Profile Sheet Set Layout Options
Use these options to define properties of a Profile sheet set. They are available in the Sheet Set Editor. For many settings, you can specify their dimensions by clicking in the editor's preview pane. In addition to the settings described below, many options allow you to specify the layer, color, and line style and text style.
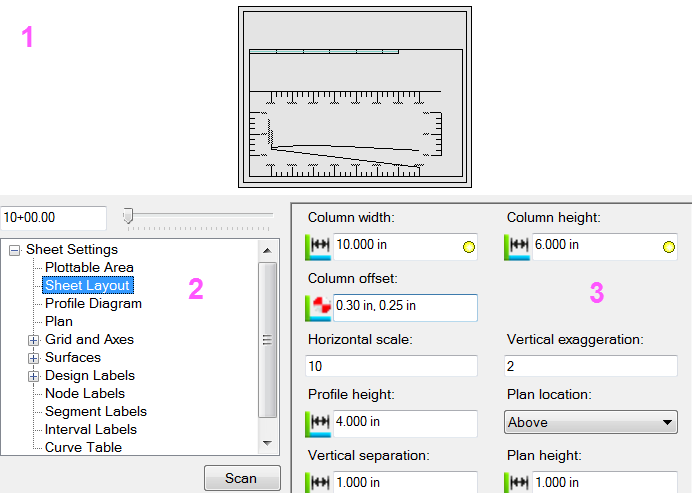
The Sheet Set Editor for a profile sheet set contains these parts:
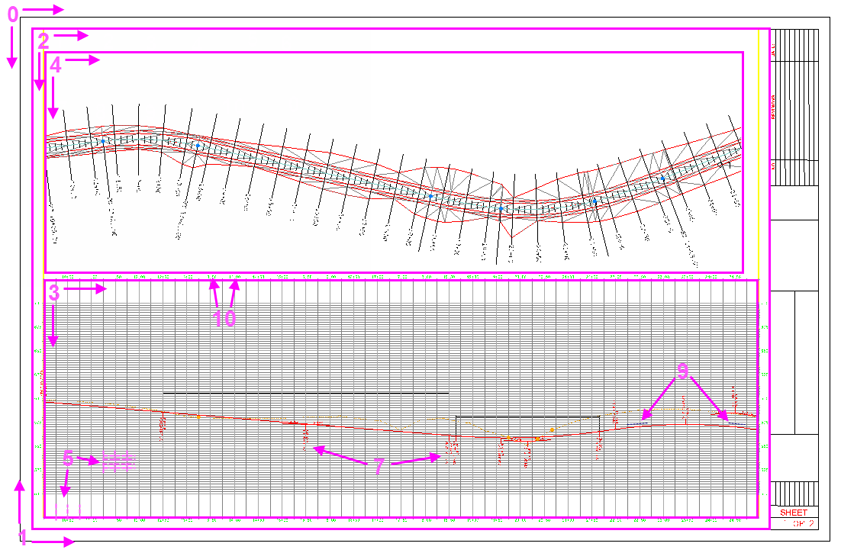
- Preview pane - This area shows a preview of the vertical alignment (VAL) profiles in relation to the grid lines, axes, labels, and other layout elements.
- Sheet Settings Explorer - This tree view enables you to navigate to the settings you want to edit.
- Settings - As you select a section in the Sheet Settings Explorer, the settings for that level appear in this area. Watch the changes in the Preview pane as you edit these settings.
Options:
- Click Scan to rebuild the corridor/surfaces along the alignment as you make changes.
Sheet Settings
0. Sheet area
- Plottable Area
- Sheet Layout
- Profile Diagram
- Plan
- Grids and Axes
- Surfaces (not shown)
- Design Labels
- Node Labels (not shown)
- Segment Labels
- Interval Labels
- Curve Table
- Profile Table (European formatting)
Descriptions of selected settings
Sheet Settings
- Paper size - Select the size of sheet to which you intend to print.
- Landscape - Check/uncheck this to specify the sheet's orientation.
- Paper width and height - This shows the dimensions of the paper you selected in the project's units (metric or Imperial).
Plottable Area
- Offset - Specify the location lower-left corner of the plottable area. You can pick this in the preview pane.
- Width and height - Specify the plottable areas dimensions. The border indicates the extents of this area.
- Draw border - Uncheck this box to hide the border around the plottable area. You may also want to put borders on a layer that can be hidden when plotting finished sheets.
Sheet Layout
Note: The Plan location, Plan height, and Vertical separation settings in this group only apply if you have Plan position set to Above or Below in the Plan group.
- Column width and height - Use these values to control how many profile diagrams fit on your sheet.
- Horizontal scale - Specify a value above 1 to exaggerate horizontal distances.
- Vertical exaggeration - Specify a value above 1 to help see elevation differences in the profile more easily.
- Profile height - Use this to control how many profiles can fit (stacked vertically) on each sheet.
- Plan location - Select whether to place the plan diagram above or below the profile diagram on each sheet.
- Vertical separation - Specify the distance between the plan diagram and the profile diagram on the sheet.
Profile Diagram
- Limit by station range - Check this box to preview the profiles only between specific stations along the alignment. Then type values in the Min station and Max station boxes to specify the extent's range.
- Break locations - Enter a station at which to split the profile diagram into separate sheets and click Add.
- Break profile - Check this box to break the profile diagram at all stations listed in the Break locations box.
- Break plan - Check this box to break the plan diagram at all stations listed in the Break locations box.
- Start new sheet - Check this box to start the profile and/or plan diagram on a new sheet after each break location.
Plan
- Plan position - Select where to place the plan diagram in relation to the profile diagram. Then modify the other plan-related settings in the Sheet Layout group.
- Rectangular dynaview - Check this box when the dynaview is rectangular.
- Dynaview filter - Select the view filter to apply to dynaviews on the sheets. See Create a Dynaview for details.
- North arrow block origin - Specify the origin for positioning the North Arrow block by selecting one of the following options from the dropdown list: Bottom Left, Bottom Right, Top Left, Top Right. The Offset will be applied with reference to this origin.
- North arrow block location - Specify the coordinates for the location of the North arrow block.
Grids and Axes
- Station minor interval - Specify how far apart to draw station tick marks on the top and bottom axes.
- Station major interval - Select how often to draw longer station tick marks (between the minor tick marks) on the top and bottom axes.
- Elevation minor interval - Specify how far apart to draw elevation tick marks on the left and right axes.
- Elevation major interval - Select how often to draw longer elevation tick marks (between the minor tick marks) on the left and right axes.
Surfaces
- Draw - Check the box for each surface you want to display in relation to the profiles.
Tunnels
- Draw - Check the box for each tunnel you want to display in relation to the profiles.
Design Labels
Note: To quickly duplicate settings from one label or line definition to another, right-click the definition in the sheet settings explorer and select Copy. A duplicate definition of the same name appears at the bottom of the same group in the tree. Select the new definition and change the name in the settings area.
- Draw - Check the box for each key vertical alignment point that you want to label.
- Draw gradient line - Check this to draw a leader line from the profile to the design label.
- Label - Type the label text you want to display, or click the Browse button to use "label instruction text"; this is text that instructs the label what to display. Label instruction text does not update dynamically and should not be confused with smart text. Follow these steps:
- In the Label Instruction Text dialog, select the type of value you want to display in the Tag list.
- Select the surface or strata from which you wish to extract the value in the Surface list.
- Specify the decimal precision for the value in the Decimal Places box.
- Click Add to add it to the label instruction text shown in the box at the bottom.
- Click OK to preview the text in the Sheet Set Editor.
- To add additional label instructions before or after the current label, work through the steps above after placing your cursor before or after the tags in the box at the bottom of the dialog.
Node labels
- Draw - Check the box to include a label for each node along each profile.
Segment Labels
Interval Labels
- Draw - Check the box to include a label for each tick mark along each profile.
Curve Table
- Draw - Check this box to include a chart of the values of key vertical alignment points for the section of the VAL on each sheet.
- Dimension style - Select the style you want to apply to the dimension, or select <New Style> to create a new style using the Dimension Style Manager.
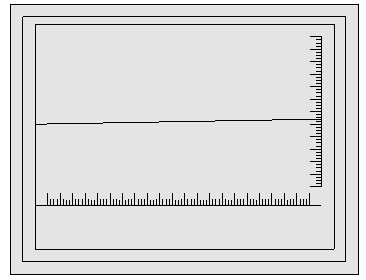
Profile Table
Follow these steps before you create a profile table:
- In the explorer, click Profile Diagram and increase the Height. You may need to come back to adjust this height.
- click Sheet layout and set Plan location to No plan.
- Click Grids and Axes and uncheck Draw top axis and Draw left axis.
- Click Design Labels and uncheck Draw for each label type.
- Click Curve Table and uncheck Draw. Expand the Curve Table group, click Dimension and uncheck Draw.
Now, when you click Profile Table and uncheck Draw, you should only see borders and profile geometry in the Preview pane.
- Draw - Check this box to include a table of the profile's station, elevation, and other values, such as grade or cross-slope. This is a format commonly used in Europe.
- Use a regular interval - Check this box to place drop-down lines at a regular distance apart (column width). Then specify the distance you want between them.
- Linework nodes - Check the box for each type of data that you want to label in the table:
- Compaction data - Check this box to include the profile of an existing machine data overlay.
- Design - Check this box to include the profile of a design surface.
- Kink row height - Specify the height of the first row in the table. Use this to adjust where you want drop-down lines to bend (kink) so that labels do not overlap each other.
- Title box width - Specify the width of the first column in the table in which the row names appear.
- Rows - Add/remove table rows (using Delete/New) for different types of surfaces (e.g., existing and design) and data (e.g., station, cut/fill). Rename and label each row by clicking its number (under Rows in the explorer), and editing its Title. Click Rows again to arrange the order of the rows (by moving them up/down). Check/uncheck the box next to each row's name to show/hide
- Label - See the general steps for adding labels under Design Labels above.
- Title - Edit this name to label the rows in the explorer and preview pane.
- Rotate labels - Labels are drawn vertically by default. Click this to draw them horizontally for small/short values, such as slopes.
- Height - Specify the height of the table rows. Use this to keep horizontal labels from overlapping each other.
- Geometry - Select an option:
- HAL geometry - Select this to label key points along the horizontal alignment.
- VAL geometry - Select this to label key points along the vertical alignment.
- Dimension settings - Select a dimension style or select <New> to open the Dimension Style Manager where you can create/edit a style for dimension lines in the table.
