Run a Utility Takeoff Report
Run a Utility Takeoff Report to compute subgrade quantities for a utility network using the average end area method. The reported volumes are not dependent upon trench surface versus target surface comparisons, but (as a generalization) use these factors to make calculations from utility node to node or end to end of each run in the network:
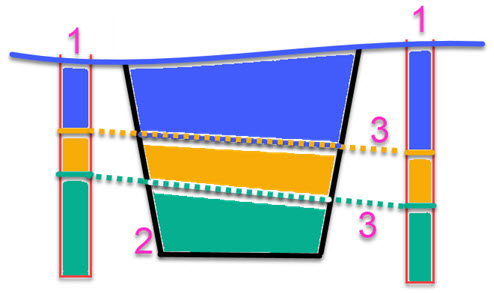
- the area of a cross-sectional trench slice defined by the bottom and sides of the trench template and their ties to the target surface (this is an 'end area')
- the volume between that end area and the next (as defined by the specified station increment/slicing interval)
- those volumes accumulated along the length of the utility run
The accumulated bank excess/deficit volume and, optionally, the accumulated cut and fill volumes at each station are reported. The backfill voulme is the total fill volume minus the volume consumed by the utility lines and nodes within the trench.
Note: Calculations in the report are based on the trench template that is used to define the utility run's trench surface. To more accurately describe what happens at a node, you need to create a template using the width of nodes and enable the Adjust at nodes option so the program places an additional template to widen the trench around each node.
This report can be generated for:
- all network types: gravity, pressure and cable
- all utility line/pipe shapes: circular, rectangular, and user-defined
- all nodes types: manhole, headwall, junction box, and fitting
The report is generated as a Microsoft® Excel spreadsheet with multiple tabs.
By tab, the report includes:
- Line Summary tab - Per pipe type: This shows the total horizontal (2D) and slope (3D) lengths for the network, both for node to node length and end to end length, as well as the totals for each length category.
- Line Takeoff tab - Per utility run: This shows the pipe length within each depth zone, as well as the installation cost per depth and the cost and length totals for the entire network.
- Calculations tab -Per utility run: This shows the mass earthwork volumes for the trenches, separated by strata type. The accumulated excess/deficit and cut/fill volumes are reported at each station.
- Node Summary tab- This shows the total count of each utility node (by site improvement type) in the reported utility network, as well as the nodes' cumulative design heights.
- Node Takeoff tab - This shows information about utility nodes per utility run, listed from the beginning station to the end station (based on stationing of the run). Nodes are not counted more than once when they are part of multiple runs (see more under Existing below). You can also review design height and elevations for each node in each run of the reported utility network. It also reports both height totals for the entire network.
Note: Generally, using the average end area method to calculate volumes ignores variabilities in trench surface geometry, such as is found in sharp turns, so the totals should be valid. You can edit a trench surface to fix how it is formed, but the trench volumes will then not agree with this report. When there is a sharp change in trench direction, a portion of the trench surface that gets created can overlap and have flags indicating an error. This will not affect the volumes in the Calculation tab. If you want to use the trench for other purposes you will need to manually fix any flags at these intersections. You may also consider breaking the run into two pieces to minimize these conditions. If you are not going to use the trench for other calculations then consider it a tool to understand the limits of construction and confirm the depths and locations. There is no need to correct the flags in that case. You can validate the general volume of your trench network by running an Earthwork Report using the Surface to surface option.
Including strata in the report
The program has the ability to determine volumes based on strata. However, since utilities use Trimble Business Center's corridor calculation engine, the strata used must be corridor-based strata built from corridor boring logs. Strata can only be defined from Earthen (Mass Earthworks) materials. The backfill can be either Earthen (Select) materials or Earthen (Mass Earthworks). The fill material is specified in the run as the Native material and should be an Earthen (Mass Earthworks) material. You should not use the same names for materials in the two earthen categories; this will cause confusion reading the report.
Prerequisites:
- License; See the Subscription Plans page. For a license matrix by command, see the License page in the TBC Community. Also see View and manage licensed features.
- Utility network with one or more trench templates applied
- Utility runs with target surfaces in the network
To access the command:
Do one of the following:
- Select File > Reports > Utility Takeoff Report > Show Report/Report Options.
- Select Utility Takeoff Report in Utility > Report.
- Right-click a utility run, and select Utility Takeoff Report from the context menu.
To run a Utility Takeoff Report:
- Select the utility network that you want to calculate volumes for in the Utility Network list.
- In the Station increment box, specify the distance between stations at which you want to report material volumes (computed using the average end area method).
- Check the Account for shrinkage and bulkage box if you:
- have previously defined earthen materials and their shrinkage and bulkage factors within the Material and Site Improvement Manage
- have assigned a native and borrow material to the utility run
- wish to use those factors to perform a more accurate mass earthwork analysis
Note: Checking this box adds the Loose haulage and Compaction Fill Supplied columns on the Calculations tab; it does not affect Compacted Excess/Deficit values (which will be the same whether this is enabled or not).
- Click . The report opens as a spreadsheet in Microsoft Excel (or your equivalent).
|
Selected Report Components |
|
|
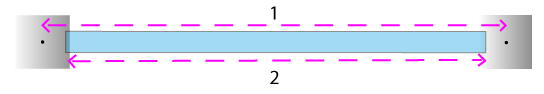
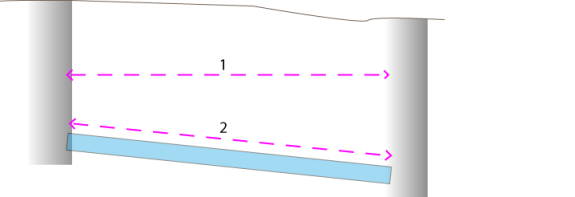
Line Summary tab Use this tab to review the total horizontal and slope lengths in the reported utility network, broken down by site improvement type. Both the 2D and 3D lengths are reported here. The totals are reported both for node to node length and end to end length.
Figure: Node to node vs. end to end pipe length (top view)
Figure: Horizontal length vs slope length (side view) |
|
| Site improvement |
Shows the type of utility line being reported on. |
| Node to Node |
Horizontal length - Shows the cumulative 2D/planimetric distance between the insertion points (usually the centers) of utility node blocks attached to the utility lines. Slope length - Shows the cumulative 3D distance between the insertion points (usually the centers) of utility nodes blocks attached to the utility lines. |
| End to End |
Horizontal length - Shows the cumulative 2D/planimetric distance between the ends of the utility lines (which are based on the specified end type for each site improvement). Slope length - Shows the cumulative 3D distance between the ends of the utility lines (which are based on the specified end type for each site improvement). |
|
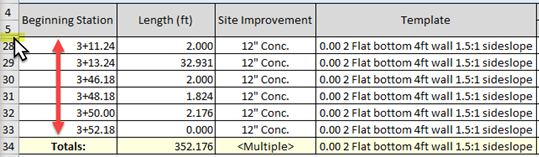
Line Takeoff tab Use this tab to review the design lengths for each line within the specified depth zones in each run of the utility network. It also reports the length totals for the entire network. This tab has a section for each utility network and each run within that network. This tab also shows the total cost to install the utility line (not including nodes). The depth zones represent the amount of work to install the line. The backfill material costs and utility line unit cost are also reported. Note: One or more rows between each run's headings and it totals are hidden by default, but can be expanded one-at-a-time by double-clicking the small, double line where rows are hidden. Each hidden row on this tab does not represent a pipe, but rather the station at which the run is evaluated. You will see one row at the end of each pipe, but also where templates are inserted and locations where the settings specify to evaluate it. This page only reports the length of each pipe (not how many pipe lengths are placed in the run). The Totals row sums all of the hidden rows for that utility run.
|
|
| Beginning station |
Shows the station (along the run) at which the reported utility line/pipe begins. '?' means that no station was specified when the run was created. |
| Length |
Shows the planimetric length of the pipe between the reported stations, which may vary slightly from the station value difference because the length is measured (but unshown) to more decimal places. |
| Site improvement |
Shows the name of the site improvement specified for the utility line. |
| Template |
Shows the name of the trench template assigned to the reported utility run (of which the reported line is a part). |
| Depth zones (quantities) Node to node |
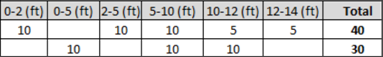
Shows the length of each utility line per depth zone (calculated along the pipe's profile). Depth zone columns are taken from all templates used across the network. Depth is calculated from target surface to bottom of the trench. Zones:
Example: Two different templates that share depth zones 5-10 and 10-12 appear like this: |
| Depth zone unit cost |
Shows the unit cost to dig the trench to the zone's maximum depth, as specified for the template in the Trench Template Manager. Note: This displays the currency format that you have set in Microsoft Windows® Regional and Language Options. The units and calculations, however, are are not associated with a specific currency, so if a project is opened on a computer with different regional settings, no conversion between currencies has been made. |
| Utility line unit cost |
Shows the unit cost of a unit of the pipe, as specified in the Material and Site Improvement Manager. |
| (backfill material) (cubic volume) |
Shows the total volume of the backfill material for the site improvement and template combination along the length of the pipe. Note: Each row shows a single site improvement + template. |
| (backfill material) Unit cost |
Shows the per unit cost of backfill material, as specified in the Material and Site Improvement Manager. |
| Bid unit cost |
Shows the total per unit cost (per meter/foot cost of total of depth cost + utility cost + backfill cost). |
| Total cost |
Shows the total cost for each site improvement for all previous rows with the listed site improvement, regardless of template. Note: Depth columns can appear for <0 when the line is above the surface and > maximum depth when the depth exceeds a maximum specified depth. Both of these assume a zero depth cost. |
|
Calculations tab Use this tab to see mass earthwork volumes for the utility network and trenches; this is essentially the soil to be removed when creating the trench, separated by strata type. Calculations are, based on a projection of the trench template to the target surface. The accumulated bank excess/deficit volume and the accumulated cut and fill volumes are reported at each station. The backfill (displaced) + backfill = total of the backfill. Sections are reported at the locations of each template and at the locations of node transitions. When you enable the Adjust at nodes setting, a calculation template is placed before and after the node at ½ the node width + the node thickness + the node offset (template setting). Another calculation template is placed at ½ the width + node thickness away from the previous template to transition back to the standard template shape. When a node is at the beginning or end of a run, only one calculation template is placed before or after the run at a station of ½ the width + node thickness + node offset distance. Note: A headwall style node has no thickness; instead, you specifies the width, which is not based on the block used to draw the node. Each run can have a different target surface, so the name of the target surface is shown in the section title. When a run starts from a node contained within another run, the trench and computed volumes will overlap. You can compensate for this by making the template start at the station that intersects the edge of the other trench. If the run crosses or ends at another node, you can insert a null template to stop the trench calculations. The trench surface that can be created does not affect these volumes. Note: Red text in this tab is the cut in-situ or geometrical values, which does not consider shrink/swell/usability of the material. Blue text in this tab is the fill/backfill in-situ or 'geometrical' values and do not consider shrink/swell/usability of the material. |
|
| From/To station |
Shows the from and to station for a section of the run based on the specified station interval, as well as important HAL points, such as the start/stop of curves, when a station equation break occurs, when a corridor template changes, and when a utility line site improvement is encountered. Note: On this tab, The first station may be odd or irregular up to the first instance of the increment specified. |
| Bank cut area |
Shows the cut area (bounded by the target surface and trench template shape) at the reporting station's cross-section. |
| Instantaneous bank cut available |
Shows the cut volume (calculated using the average end-area method) between the previous cross-sectional area reporting station and the current station. |
| Accumulated bank cut available |
Shows the total cumulative cut volume from the beginning of the run to the current station. |
| Loose haulage
|
Shows the accumulated, uncompacted loose volume (cut volume * loose haulage factor) of material that will be dug up to this point. The loose haulage amount considers the hauling bulkage of each strata material, but does not consider the usability. Note: This value uses the material density states of the native, in-situ material and is only shown if you checked Account for shrinkage and bulkage in the command.
|
| Compacted fill supplied |
Shows the accumulated, compacted volume (cut volume * shrinkage factor) of material that may be dug up and then backfilled into the trench. This column considers the shrinkage and usability of all strata materials combined. This will be the total material that can be used for backfill. If you want to waste a strata material being excavated, then it should be set to 0% usable in the Material and Site Improvement Manager. If strata exist, these are reported in an additional column:
Note: If no strata has been defined, this value uses the material density properties of the native, in-situ material and is only shown if you checked Account for shrinkage and bulkage in the command. |
| Earthen (Mass earthworks) <Strata material name>
Each stratum (as ordered in Define Strata dialog) along the network has two columns: Area and Accumulated (volume). |
|
| Area (square units) |
At each reported station increment, all strata (3 below) encountered in the trench (2 below) (based on the nearest site borehole data (1 below)) is used to calculate the cross-sectional areas of the materials that need to be dug out.
|
| Accumulated (cubic units) |
Shows the accumulated cut volume (using the average end area method) for each stratum between each station increment (from the beginning station to this one. |
| Earthen (Select) <backfill material name>
Each backfill material along the network has three columns: Displaced (area), Area, and Accumulated (volume). |
|
| Displaced (area) |
Shows the cross-sectional area of backfill material that the utility line displaces at the station (1 below). The accumulated utility line + accumulated backfill = accumilated bank cut.
|
| Area |
Shows the cross-sectional area of trench material at the reported station (solid area above). |
| Accumulated (volume) |
Shows the cumulative volume (using average end area method) of trench backfill (not including displaced material) from the beginning station to this station. |
| Utility line
This shows the area and volume occupied in the trench by the utility line itself. |
|
| Area |
Shows the cross-sectional area of the utility line at the reported station. |
| Accumulated (volume) |
Shows the volume occupied by the utility line between stations (area * (to station - from station)), assuming that the lines have the same shape at both ends. |
| Compacted excess/deficit (volume) |
Shows the accumulated volume of excess or deficit material from the beginning station to this station. The compacted excess/deficit column is calculated by subtracting the accumulated native material specified for the run from the compacted fill supplied. |
|
Node Summary tab Use this tab to review the total count of each utility node (by site improvement type) in the reported utility network, as well as the nodes' cumulative design heights (generally the depths below the target surface). Note: Nodes that are in the network, but not any run, are also reported. |
|
| Node type |
Shows the general type of utility node being reported on. |
| Site improvement |
Shows the specific site improvement type of utility node being reported on. |
| Count |
Shows the number of instances of each node in the network. Individual nodes are counted only once, regardless of how many utility runs they are in. |
| Design total height |
Shows the cumulative sum of all of the nodes' heights, as measured from the invert to the rim (usually so you can determine how many vertical feet will need to be dug when constructing all of the utility node site improvements). Note: This value is only reported for manholes and junction boxes; other node types do not have an invert and rim elevation from which to calculate the heights. |
|
Node Takeoff tab Use this tab to see information about utility nodes per utility run, listed from the beginning station to the end station (based on stationing of the run). Nodes are not counted more than once when they are part of multiple runs (see more under Existing below). You can also review design height and elevations for each node in each run of the reported utility network. It also reports both height totals for the entire network. |
|
| Utility run |
Shows the ID of the run. |
| Station |
Show the station at the center (insertion point) of the reported utility node. |
| Node name |
Shows the ID of the node. |
| Description |
Shows the optional descriptive text for the node. |
| Existing |
Nodes that already exist are listed, but not counted in design height totals nor in the count total at the bottom of the tab. Nodes that are not included in any run are also counted.
|
| Site improvement |
Shows the name of the utility node site improvement. |
| Type |
Shows the kind of node: fitting, manhole, junction box, or headwall |
| Invert elevation |
Shows the elevation of the invert. |
| Rim elevation |
Shows the elevation at the top of the utility node. |
| Design height |
Shows each node's design height and total design height for the run. |
| Volume |
Shows each node's volume (height x area of site improvement) and total node volumes for the run. Note: This volume is reported for manholes and junction boxes, but not for headwalls. |

Scenarios:
- If your run has a multi-segment pipe, the height of the pipe is derived from its centerline. The slope length of a multi-segment pipe includes the lengths of all segments.
To change report settings:
- Select Report Options.
Dependencies:
- The volume calculations are dependent on the trench template, utility run, and the associated target surface.
