Run a Tunnel As-Built Report
Generate a customizable Microsoft® Word-based report that compares assigned as-built points with a tunnel design to determine overbreak and underbreak information for quality checking and communications.
Prerequisites:
- Licensed module. See the Subscription Plans page. For a license matrix by command, see the License page in the TBC Community. Also see View and manage licensed features.
- You must assign imported as-built points to the tunnel before generating a Tunnel As-Built Report.
To set Tunnel As-Built Report options:
- Select Report Options in the Quick Access Toolbar to display the Report Options command pane.
- In the Reports list, select Tunnel As-Built Report or Tunnel As-Built Report (with best-fit circle).
- Edit Settings options as necessary.
To run a Tunnel As-Built Report:
- Select Tunnel As-Built Report or Tunnel As-Built Report (with best-fit circle) in Tunnels > Reports to display the Tunnel As-Built Report command pane.
The Tunnel As-Built Report (with best-fit circle), is identical to the standard Tunnel As-Built Report except that, when used with a tunnel design with a consistent circular radius, it includes in each station cross-section view a point that indicates the location of the tunnel alignment and a point that indicates the center of a best-fit circle calculated from the assigned as-built-points. Delta values for these two points are displayed in a table beneath the cross-section view. Optionally, you can create 3D points in your project from the best-fit points, as described later in this procedure.
Note: A best-fit calculation and comparison for circular tunnel profiles is key metric for verifying the final placement of ring positions for TBM (tunnel boring machine) tunnels.
- In the Report template drop-down list, ensure the appropriate predefined report template is selected, or, if applicable, select a custom report template.
To create a customized version of either of the provided default templates(for example, add available unused fields to the report),see Create and Edit Customized Report Templates.
- Select the Tunnel and Tunnel shape on which to base the report.
The stations to which as-built points have been assigned are displayed in the As-built points table.
Note: To assign as-built points to stations, see Assign Tunnel As-Built Points.
- Optionally, change the Begin station and End station for the report.
By default, the begin and end stations specified for the tunnel are selected. But you can change them as necessary to select a subset of stations. Only the stations with assigned as-built points included in the selection will be included in the report.
Note: You have the option to enter a start station greater than the end station to reverse the stationing direction to run from the end station to the start station. The viewing direction and offsets in the report are reversed, resulting in positive offsets to the left and negative offsets to the right. This is a great benefit when, for example, a tunnel is being constructed from the end station to the start station (for example, construction is proceeding from station 2+500 towards station 1+000).
- In the Settings group, select tolerance values that if exceeded will be easy to identify in the report due to color coding of points in cross-section views and in delta values in tables.
- Station tolerance - Enter a distance value along the alignment that if exceeded will cause a point and its station delta value to display in the report in the color specified in the Station exceeded color field.
- Overbreak tolerance - Enter an overbreak distance value that if exceeded will cause a point and its delta value to display in the report in the color specified in the Overbreak exceeded color field.
- Underbreak tolerance - Enter an underbreak distance value that if exceeded (that is, the actual value is less) will cause a point and its delta value to display in the report in the color specified in the Underbreak exceeded color field.
- Color within tolerances - Specify the color to apply to a point and its delta value that is within all tolerances.
- Ignore outliers - Check this check box to specify that any points exceeding the specified Outlier tolerances distance will not be included in the report.
- Image Scaling - Select the appropriate option for the scaling of images for each station in the report.
- If you are running a Tunnel As-Built Report (with best-fit circle) report, optionally do the following:
- Check the Create points at best-fit circle center check box to specify to create a 3D point at the center of the best-fit circle calculated at each station.
- In the Starting points field, optionally change the automatic point numbering default starting point value, which labels the first and each subsequent new best-fit point with the prefix ComputedBFC followed by an underscore and the station number.
- In the Points layer drop-down list, select the layer to which all new best-fit points will be assigned.
- In the For best-fit circle delta value, compute drop-down list, select the delta computation option that best suits the requirements of your audience.
- Click the Apply button.
The report opens in MS Word. Each station contained in the report includes a cross-section view of the tunnel showing the location of assigned as-built points along with point/design delta distances. Points are colored as specified in step 5. The view includes all shapes associated with the tunnel design to provide greater detail for construction verification.
Following is an example of the standard Tunnel As-Built Report:
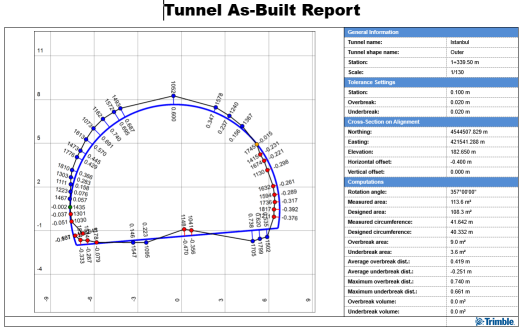
To the right of the cross-section view, a table provides general information about the tunnel and the station, along with tolerance settings applied to computations, the location of the cross-section on the alignment, and the results of various computations performed.
Following is an example of the Tunnel As-Built Report (with best-fit circle).
1 = A point indicating the center of the best-fit circle calculated from the assigned as-built-points
2 = A point indicating the tunnel alignment.
(To save these points as named 3D points in your project, see step 6 above.)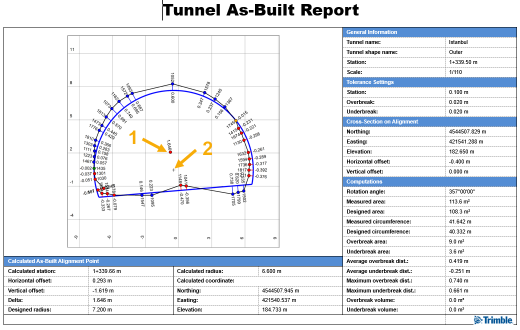
Beneath the cross-section view, a table provides information about the calculated center point and its distance form the alignment point.
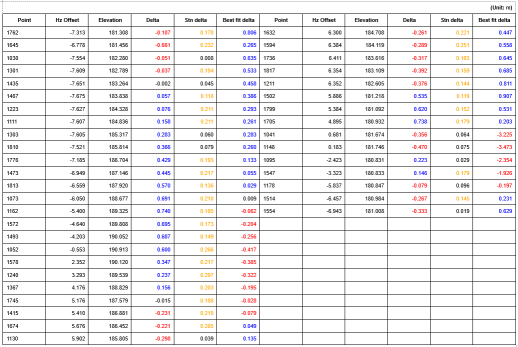
For either report template, each station also includes a table of points along with delta values that are colored as specified in step 5.
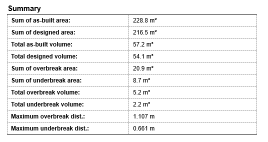
A "Summary" table located at the end of the report includes as-built, designed, overbreak, and underbreak area sums and total volumes. (Total volumes are calculated using the average end area method based on the total length of the tunnel and the cross-sections in the report.) It also includes maximum overbreak and underbreak delta distances.
- Optionally, save the Word file with a new name to the location of your choice.
