Points Spreadsheet
The Points Spreadsheet view lists the survey points in the current project, enabling you to easily edit the data. The Plan View and the Properties pane reflect all changes made to data in the spreadsheet view.
Prerequisites:
- survey points
To access the command:
- Select Points Spreadsheet in Home > Data.
- Right-click Points (or one or more points) in the Project Explorer, and select New Points Spreadsheet from the context menu.
Project settings for the spreadsheet:
- Select Project Settings in the Quick Access Toolbar. Then select View > Points Spreadsheet to specify whether to show Grid, Local, Global, or ECEF coordinates (Northing, Easting, Elevation (NEZ), Latitude, Longitude, Height (LLH), or XYZ values) in the spreadsheet.
Using the spreadsheet:
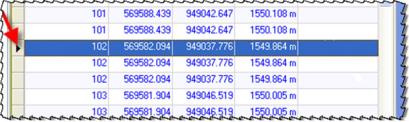
- To select a point, click in the left column for that row.
- To display more detail on a point in the Properties pane, select the point and press , or right-click and select Properties.
- To edit a point's ID, coordinate, elevation, or feature code, select it by clicking on the cell. You can also tab from cell to cell and simply type over the value in the cell.
- To sort points based on a criteria, click on a column heading. Up
 or down
  icons appear on the selected column heading, indicating the current sort order (ascending or descending).
 - To filter the point data, click on the
 icon at the top of the column and select an option from the drop-down menu.
 Note: If the filter for a column is active, the icon
 appears blue.
 - To copy data to a text editor, such as Microsoft® Notepad, select data, and copy and paste by using the right-click menu or by pressing to copy and to paste. You can select all data by pressing .
Tip: To easily copy-and-paste any value from the Points Spreadsheet into a text field elsewhere in the program, float the spreadsheet (right-click and select Float View) on a second monitor so the point data is readily available..
To manage column display:
- To select to show or hide any of the columns available for the spreadsheet, select Project Settings in the Quick Access Toolbarand select View > Points Spreadsheet.
- To change the order of columns in the spreadsheet, click and drag any column heading to a new location.
