Inspect Pavement Condition
When working with Mobile Mapping data, use the Inspect Pavement Condition command to perform an automatic inspection of a selected section of scanned roadway pavement to identify visible conditions on the road's surface that may require attention (such as alligator and linear cracks, depressions, corrugations, rutting, potholes, and bumps) and extract them as features with attributes into the project.
Extracted condition features are displayed in graphic views and in the Project Explorer, where they are grouped by sample units and, optionally, segments to aid in their real-world location. You can specify the thresholds for low-, medium-, and high-level severity conditions (based on, for example, the depth and width of a pothole) so that extracted condition features are appropriately labeled in the Properties pane and in reports. This also enables severity labeling based on the ASTM Pavement Condition Index for both entire inspected sample units and each of the segments contained within them. Additionally, you can select to display in the graphic views a heat map (point cloud) indicating elevation differences between the real and the estimated ideal pavement surface. Analysis results can be printed to a Pavement Condition Inspection report that can easily be shared with others.
In addition, after performing the inspection using the Analyze tab in the Inspect Pavement Condition command, you can use the Post QA/QC tab to verify which segments have been inspected, assign a treatment type, and export the segments which need treatment as a .shp file.
You can pull segmented road networks from AgileAssets to perform pavement inspections, then export the PCI analysis back into AgileAssets. See Import and Export Road Segments in AgileAssets.
Prerequisites:
- See the Subscription Plans page. For a license matrix by command, see the License page in the TBC Community. Also see View and manage licensed features.
- Because the command runs on a visible point cloud, it is recommended that you classify the point cloud and use only Ground class for the analysis. This will help exclude all irrelevant classes, especially moving and parked vehicles and people (region Noise).
- For Road Network Analysis Mode, you must use feature coded lines with unique feature attributes in order to properly map road network conditions.
Note: This topic includes the following two sections, which should be performed in the order shown:
- Analyze tab - Inspect pavement condition
- Post QA/QC tab - QA/QC pavement inspection results
Analyze tab - Inspect asphalt pavement condition:
- Click Inspect Pavement Condition in Mobile Mapping > Analysis to display the Inspect Pavement Condition command pane.
- Click the Analyze tab.
- Under Pavement Type, select Asphalt.
- Select Automatic or Road Network Analysis Mode.
- Click in the Selected mobile mapping run field and then, in a graphic view or in the Project Explorer, select the Mobile Mapping run for which you want to perform an inspection.
- If you selected Road Network analysis mode, click in the Select Road Network segments field and then, in a graphic view, select the road network segments with the associated Mobile Mapping run.
- Select the appropriate attribute from the Unique Segment Identifier dropdown list.
- Optionally, click the Use Lane Line ID checkbox, then enter a lane name in the Lane name field. If you specify a name, the segment ID will be the unique segment identifier plus the name you entered. If the field is left blank, the segment ID is just the unique segment identifier.
- If you selected Automatic analysis mode, click in the Select Road Network segments field and then, in a graphic view, select the road network segments with the associated Mobile Mapping run.
- Under Select lane lines, do either of the following:
Note: You can only select one lane line per batch. To select multiple lane lines, use the Confirm Selection button as described in step 10.
- If appropriate linestrings for the lane lines already exist, click in the Select lane lines field and select them in a graphic view.
- If appropriate linestrings for the lane lines do not already exist, either click the Create Linestring button to create them, as explained in Create and Edit a Linestring, or click the Extract Lane Lines button to extract them as explained in Extract Line Features from a Point Cloud.
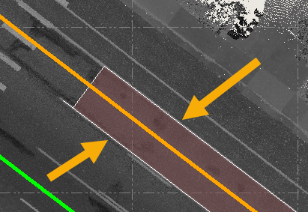
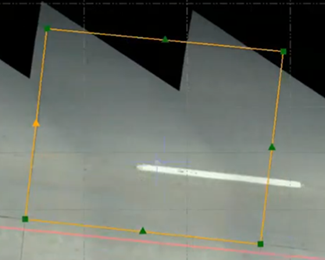
In the following example, the Extract Lane Lines command was used to create two linestrings for the two lane lines bordering the pavement to be inspected. The linestrings were automatically connected at the ends, resulting in a polygonal selection.
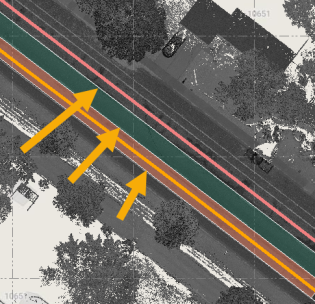
In this next example, three lines were selected, resulting in a separate polygon for each lane to be inspected and included in the Pavement Condition Inspection Report (each is colored differently).
- Optionally, change any of the Analysis Parameters:
- Sample unit area size - Enter the size of the area to be used to divide the selected pavement into smaller sample units for inspection and display of analysis results. This parameter is particularly relevant for those users who are following the American Society for Testing and Materials (ASTM) standard for pavement condition inspection.
- Analyze per segment - Check to divide each sample unit into even smaller sections for inspection and display of analysis results. This parameter is helpful in obtaining detailed localization of problematic areas within larger sample units.
- Sample segment length - Enter the length of each sample segment to be used to divide each sample unit into even smaller sections for inspection and display of analysis results. Each found condition is contained within a segment, which is, in turn, contained within a sample unit area of the pavement.
- Use cross section intervals - Check to include cross section intervals in the analysis.
- Interval for cross slope calculation - Enter the interval length between each cross section.
- Height/depth threshold - Enter the vertical distance above and below the pavement surface that, if exceeded, will cause a scan point to be excluded from the analysis.
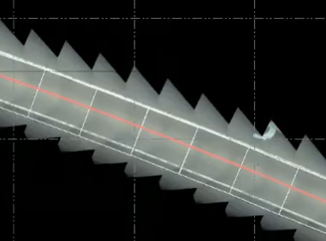
- Detect cracks - Check to include crack detection in the analysis. This parameter is available only if a back-facing Mobile Mapping camera is included in the project. Select the appropriate option:
- Back camera - This option uses raw photo images to detect crack conditions, to which a static severity level is assigned.
- Ortho Lane - This option uses orthorectified images generated through the Ortho Lane command to detect crack conditions, resulting in more precise crack detection than available with the Back Camera option. Severity is dynamically assigned to crack conditions based on their width or, in the case of alligator cracks, their density. This option is available only if the project includes an OrthoLane_.tif file generated by the Ortho Lane command.
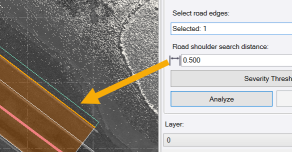
- Analyze road shoulder - Check to include in the inspection the measurement of the drop-off (difference in elevation) between the edge of a road's pavement and the shoulder to identify low, medium, and high severity levels for individual drop-off conditions. If checked, complete the following fields:
- Select road edges - Select a lane line nearest to the road's edge.
- Road shoulder search dstance - Enter the distance from the selected road edge line to search for the road's shoulder. The distance is represented by a blue line offset from the road edge line.
- If you selected Road Network Analysis Mode, click Confirm Selection. This creates a single batch of road networks to analyze.
- Repeat steps 5-10 for each batch that you want to create.
- Click Discard previous selection to discard the most recently-created batch.
- View and change the severity level thresholds for each condition type as follows:
- Click the Severity Thresholds button to display the Inspect Pavement Condition dialog.
- Click any condition type to view and/or change its severity level thresholds, which can be vertical distances, diameters, or other criteria.
To reset the default American Society for Testing and Materials (ASTM) settings, click the ASTM Default button.
- When you are done, click OK.
- Click the Analyze button to start the analysis process.
Progress is displayed in the Status Bar at the bottom of the window.
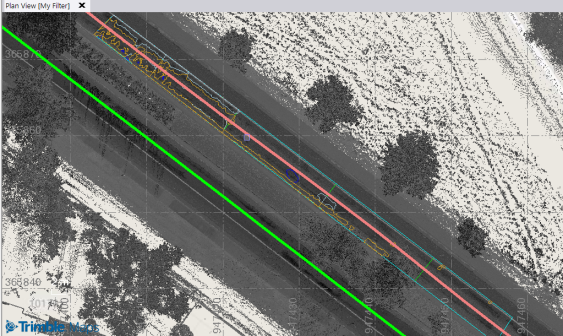
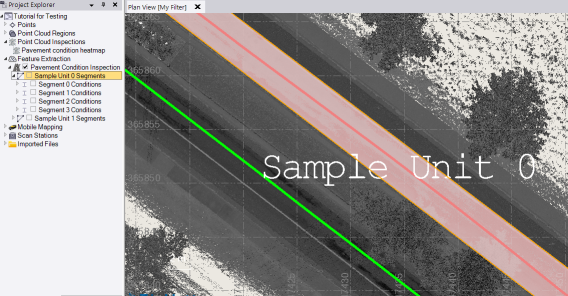
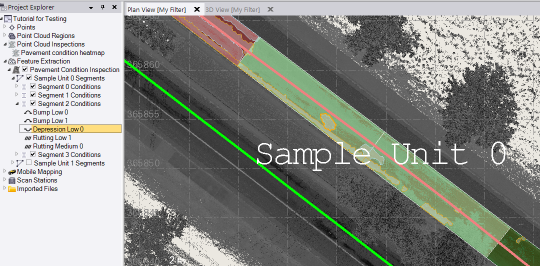
When the analysis process is complete, sample units and segments are identified in the graphic views. In the following example, two sample units were created with multiple segments each. Sample units include blue border lines, while segments are separated by green separator lines. In addition, different colored lines are used to identify various found pavement conditions. The display is temporary until you click the Confirm Analysis button later in this procedure.
- Select the Layer on which the sample units, sample segments, and conditions are displayed, or select <<New Layer>> to create a new layer.
It is recommended that you create a new layer on which to display the PCI features so that you can isolate them for viewing after the analysis.
You can select separate layers to store the outlines of sample units and of segments in the Settings dialog as described in step 16. Additionally, you can select to display the labels for sample units and segments on a separate layer and change the text style in the Settings dialog as described in step 9.
- In the Filtering drop-down section, uncheck any Severity Level and Classification you do not want to include in the analysis results. Uncheck Cross Sections if you do not want to include cross slope calculations in the analysis results.
The conditions and severities that are unchecked will not be displayed after the confirmation of the analysis, will not appear in the report, and will not be used for the calculation of the Pavement Condition Score.
- Optionally, click the Settings button in the command toolbar and make changes as necessary:
- PCI Labels - Select the text style and layer to use for PCI labels
- Sample Units and Segments - Select the layer(s) on which to display inspection results based on the pavement condition or sample units and segments.
- Pavement Area - Enter the maximum distance on either side of the trajectory within which you want the command to analyze the pavement.
Also, specify whether the analysis should Ignore manholes (point data) (or, for example, catch basins) based on a specified Manhole diameter. If manholes or any other street assets are not excluded from analysis using this setting, they will be considered as irregularities.
Click OK when you are done.
- Click the Confirm Analysis button to save the analysis results.
Note: If you click the Close button before confirming the analysis, a warning pop-up asks if you want to save the unconfirmed analysis results. Click Yes to save the results, or No to discard the results.
A new label displays for each Sample Unit identified in the Plan View. To see the results of the analysis, see View the analysis results below.
Analyze tab - Inspect jointed concrete pavement condition:
- Click Inspect Pavement Condition in Mobile Mapping > Analysis to display the Inspect Pavement Condition command pane.
- Click the Analyze tab.
- Under Pavement Type, select Jointed Concrete.
- Select Automatic.
Note: If you selected Jointed Concrete, Road Network Analysis Mode is unavailable.
- Click in the Selected mobile mapping run field and then, in a graphic view or in the Project Explorer, select the Mobile Mapping run for which you want to perform an inspection.
- In Select slabs, do either of the following:
- If appropriate linestrings for the slabs already exist, click in the Select slabs field and select them in a graphic view.
- If appropriate linestrings for the slabs do not already exist, click the Detect slabs button to create them.
Use the Confidence filter (%) slider to check all slabs with a confidence below this level. To ensure high confidence, in the Plan view, zoom in on any slab with a low confidence level and use the mouse to adjust the edges of the slab. This automatically sets the confidence of that slab to 100%.
Use the left and right arrows to scroll through the slabs. Note: You cannot use the arrows to scroll through user-imported slabs.
- Optionally, change the Analysis Parameters:
- Number of slabs per sample unit (jointed concrete only) - Enter the number of slabs per sample unit to analyze. The default is 20. Larger numbers can result in slower processing. Skip to step 13.
- Click the Analyze button to start the analysis process.
Progress is displayed in the Status Bar at the bottom of the window.
When the analysis process is complete, sample units and segments are identified in the graphic views. In the following example, two sample units were created with multiple segments each. Sample units include blue border lines, while segments are separated by green separator lines. In addition, different colored lines are used to identify various found pavement conditions. The display is temporary until you click the Confirm Analysis button later in this procedure.
- Select the Layer on which the sample units, sample segments, and conditions are displayed, or select <<New Layer>> to create a new layer.
It is recommended that you create a new layer on which to display the PCI features so that you can isolate them for viewing after the analysis.
You can select separate layers to store the outlines of sample units and of segments in the Settings dialog as described in step 16. Additionally, you can select to display the labels for sample units and segments on a separate layer and change the text style in the Settings dialog as described in step 9.
- In the Filtering drop-down section, uncheck any Severity Level and Classification you do not want to include in the analysis results.
The conditions and severities that are unchecked will not be displayed after the confirmation of the analysis, will not appear in the report, and will not be used for the calculation of the Pavement Condition Score.
- Optionally, click the Settings button in the command toolbar and make changes as necessary:
- PCI Labels - Select the text style and layer to use for PCI labels
- Sample Units and Segments - Select the layer(s) on which to display inspection results based on the pavement condition or sample units and segments.
Click OK to confirm your selections and close this window.
- Click the Confirm Analysis button to save the analysis results. Click the Discard Analysis button to discard the results.
Note: If you click the Close button before confirming the analysis, a warning pop-up asks if you want to save the unconfirmed analysis results. Click Yes to save the results, or No to discard the results.
A new label displays for each Sample Unit identified in the Plan View. To see the results of the analysis, see View the analysis results below.
View the analysis results:
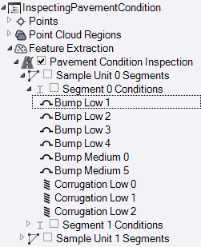
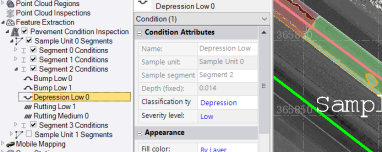
In the Project Explorer, a new Pavement Condition Inspection node displays nested beneath the Feature Extraction node. Nested beneath the Pavement Condition Inspection node are one or more Sample Unit nodes. Expand any Sample Unit node to view its individual Segment nodes, each of which in turn can be expanded to show each of the pavement conditions found in the segment.
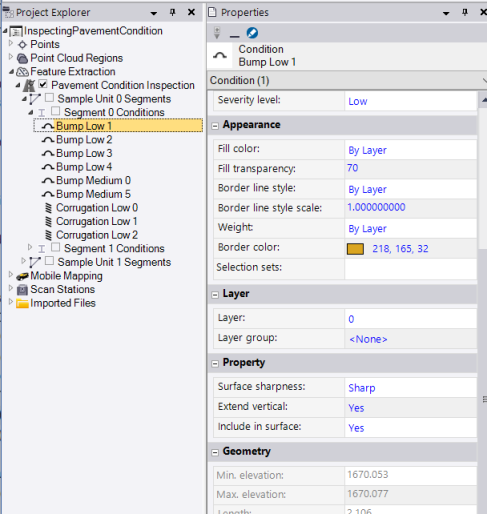
Double-click any Condition node to view information about the condition.
Using the Project Explorer, you can show or hide elements in graphic views as follows:
- To show/hide all sample blocks, right-click the Pavement Condition Inspection node and select Visualize/Hide All Sample Units for the Pavement Condition Inspection.
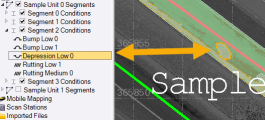
- To show/hide all segments and/or conditions for each individual sample unit, right-click the Sample Unit Segments node and select Visualize/Hide Segments for the Sample Unit.
- To show/hide all conditions for each individual segment, right-click the Segment node and select Visualize/Hide Conditions for the Segment.
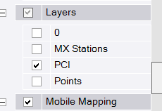
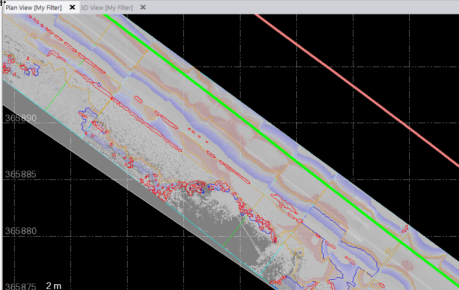
In the View Filter Manager, you can use the check boxes to show or hide sample units and segments in the Plan View. In the following example, a segment node has been expanded to show all of the pavement conditions found in the segment. In addition, all layers were hidden except the new layer created for the PCI elements.
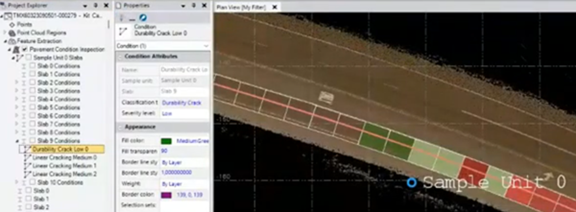
You can select any pavement condition to highlight it in the Plan View. Or, you can select it in the Plan View to highlight it in the Project Explorer.
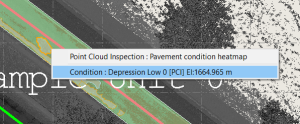
You can also select a pavement condition in a graphic view to see the condition type, severity level, and elevation.
Each pavement condition border is colored based on the condition type.
You can double-click any Sample Unit or Segment node in the Project Explorer to view its properties, including its PCI score. In addition, a transparent color is overlaid on each segment in the graphic views indicating its overall PCI score.
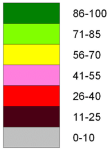
Good 86-100
Satisfactory 71-85
Fair 56-70
Poor 41-55
Very Poor 26-40
Serious 11-25
Failed 0-10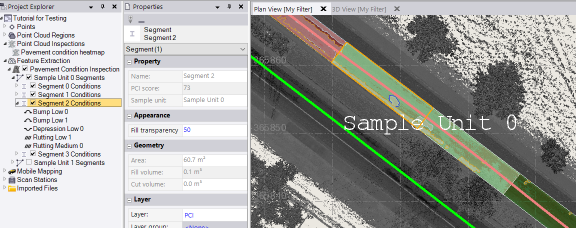
You can double-click any pavement condition node to views its properties, including its severity level.
If necessary, you can export the results of the analysis as vector data in a variety of formats. To export (or view) sample units and sample blocks that fall within certain severity ranges, it is recommended that you use the Advanced Select command.
The GIS Shapefile exporter enables you to select to export to an Esri Shapefile all important polygon and polyline feature attributes extracted for pavement conditions (for example, cracks and potholes) during a pavement inspection, including diameter, height/depth, slope length, severity level, and more, as applicable.
In addition, the GIS Shapefile exporter enables you to select to include or not include area, length, and ID attributes for non-pavement condition geometry in the export. (Regardless of this setting, these attributes are always exported with pavement condition geometry.)
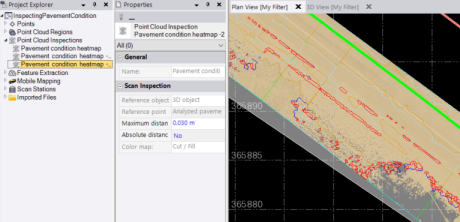
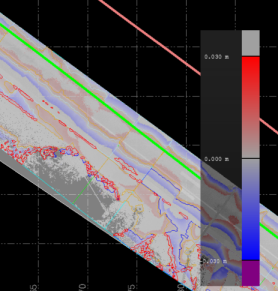
- To generate a heatmap indicating elevation differences between the real and the estimated ideal pavement surface in one or more sample units, use either of the following methods:
- Select one or more sample units in a graphic view, right-click, and select Generate Heatmap.
- Select one or more Feature Extraction > Pavement Condition Inspection > Sample Unit nodes in the Project Explorer, right-click, and select Generate Heatmap.
Use Ctrl+click or Shift+click for multiple selections.
Note that if selected sample units share common borders, a single region and a single inspection heatmap will be generated for them.
To view properties for a heatmap, right-clickthe Point Cloud Inspections > Pavement condition heatmap node in the Project Explorer and select Properties. Here you can change the maximum distance used for comparison and whether to use only positive values when evaluating the scan inspection.
To view a legend for a heatmap, select it in a graphic view or the Project Explorer, right-click, and select Toggle Legend.
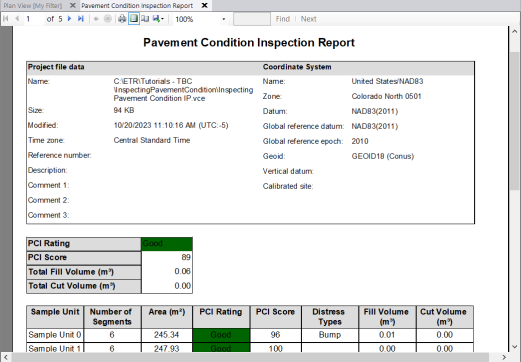
- To print the analysis results to a report, click the Pavement Condition Inspection Report icon in the Inspect Pavement Condition command pane toolbar.
Post QA/QC tab - QA/QC pavement inspection results:
To run a QA/QC on Pavement Condition Index (PCI) segments, first use the Inspect Pavement Condition command to generate an inspection of a selected section of scanned roadway pavement.
- Click the QA/QC tab.
- In the Inspect segments with the PCI score below field, specify a PCI value to perform QA only on the segments below a specified PCI score. This field accepts numbers from 0 to 100.
Note: By default, the QA/QC process starts from Segment 1. If the QA/QC process has started but not finished, and the TBC project was saved and closed, the QA starts from the last inspected segment.
- Use the Filter Segments drop-down list to select which segments on which to run the QA/QC procedure:
- Show all shows all segments.
- Show inspected shows only those segments that have already been inspected.
- Show not inspected shows only those segments that have not been inspected.
Note: Inspected segments are those that have a Treatment type selected.
- The Current segment field shows the selected segment. Click the left and right arrows to cycle through the segments.
The current segment is outlined in red on the Plan View window.
- In the Treatment type drop-down list, choose a treatment type to apply to the active segment.
Select the <Custom treatment> option to open the Treatment Type Manager window. Click New treatment type, enter the new treatment type, and click Close.
- Optionally, enter Comments.
- Click Close to close the command.
Changes made on this screen are automatically saved.
- To export the analysis results as a .shp file, follow the Export Data process.
Select GIS from the File Format group, then select Shapefile exporter from the list of available exporters.
- Optionally, to specify a type of data to export (such as Treatment Type or PCI Score), use the Select Using Advanced Criteria feature.
