Map View
The  Map View enables you to visualize the scan data from the Top View (default view) and locked in 2D.
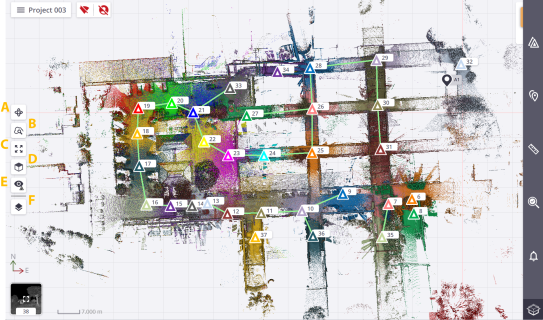
In this view, a station has a point cloud representation, with a Marker (station setup position)  and Label (name)
  . You can:
- Zoom in (or zoom out) all the displayed stations by stretching or pinching with two fingers.
- Pan by sliding with one finger.
- Zoom on a displayed station (or an empty area) by double tapping the station (or an empty area), with a factor of 1.75.
Or tap:
- A -
 3D View to switch from the current view (2D locked view) to an unlocked view. See 3D View.
 - B -
 Magnify to load more points inside a specific area. See Magnify.
 - C -
 Zoom Extends to fit the scanning result(s) to the center of the view.
 - D -
 Views to display the scanning results from Top View, Front View and Right View.
-
E - View Options to expand the options. Tap one of the following:
 to display all hidden stations.
  to hide all displayed stations. Hiding all displayed stations hides all station positions, labels, registration links and all created annotation and precision points (see Points Tool).
 to display the most recent station(s). The number of most recent stations needs to be defined in the
  Settings > General.
 You can also tap a station position in the view and choose Display Nearest from the dropped-down list.
 to display the stations near the selected one. See Display Nearest. The number of nearest stations has to be defined in the Settings > General.
-
F -
 Rendering Options to access the options below. Tap:
 to hide all the points whose normal faces the screen (towards or backwards).
  to display points of the scan data without any visibility filtering.
  to change the display point size.
 to hide all station markers, and labels (if displayed), and registration links (if existed).
 to display all station markers, and labels (if displayed), and registration links (if existed).
 to hide all station labels. Display first all station positions.
 to display all station labels.
  to render the displayed points with one color per station.
 to render the displayed points with one color per scan.
 to render the displayed points with color-coded intensity.
 to render the displayed points using the gray scale defined by their intensity.
 to render the displayed points using their color (real color).
 to render based on the height information found in the points in the Left Side (or Right Side) view.
 to render the displayed points with one color per group (registration set).
 to render the displayed floor surface with different elevations indicated by colors from the default Color Palette (Red, Grey, and Blue). See Inspection Tool.
The Inspection Preview rendering feature is enabled only in the Cut and Fill tool (see Inspection Tool).
 to hide a 2D Grid over the scan data.
This Cross defines the origin of the project (0,0,0 as coordinates in the XYZ coordinate system). It is replaced by a 2D Grid when hidden.
 to display a 2D Grid over the scan data in Top View.
 to change the background color of the Map View to black.
 to change the background color of the Map View to white.
 to display all annotations or precision points (Pins and Labels).
 to hide all annotations or precision points (Pin and Label).
 to display all annotations or precision points of a chosen station.
-
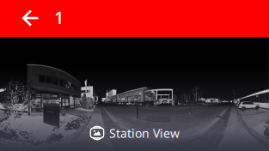
To display the current station in the Station View (see Station View):
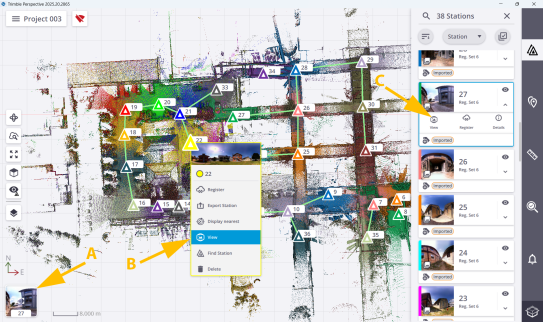
A - The thumbnail at the bottom left corner.
B - A station position to select
 View from the dropped-down list.
C -
View of a station card in the Stations List panel.In the Station Details panel, tap the thumbnail to switch from Map View to Station View.