Run a Tunnel Inspection Report
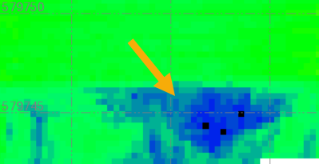
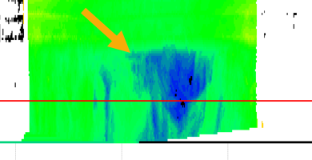
Run a customizable Microsoft® Word-based report based on a tunnel inspection map that compares the shape of two tunnel meshes to identify differences between them. Depending on the tunnel inspection map you select, you can compare a designed tunnel mesh to an as-built tunnel mesh (for example, compare the design mesh to an as-built excavation mesh). Or, you can select to compare an as-built tunnel mesh to another as-built tunnel mesh (for example, compare an as-built excavation mesh to an as-built shotcrete mesh). Images and information used in the Tunnel Inspection Report comes directly from the Tunnel Inspection View.
Optionally, you can run the Tunnel Inspection Report (with geological overprofile), which is identical to the Tunnel Inspection Report except that it also includes the following geological overprofile information for drill and blast headings and tunnel boring machine (TBM) headings:
- Geological overprofile area for each station
- Geological overprofile volume for each station
- Total geological overprofile volume for all stations
These values are computed based on Swiss underground construction and tunnel Norm SIA198 for calculations and reporting.
 Note on geological overprofiles...
Prerequisites:
- Licensed module. See the Subscription Plans page. For a license matrix by command, see the License page in the TBC Community. Also see View and manage licensed features.
- A tunnel inspection map.
To set Tunnel Inspection Report options:
- Select Report Options in the Quick Access Toolbar to display the Report Options command pane.
- In the Reports list, select Tunnel Inspection Report or Tunnel Inspection Report (with geological overprofile).
- Edit Settings options as necessary.
To run a Tunnel Inspection Report or Tunnel Inspection Report (with geological overprofile):
- Select Tunnel Inspection Report in Tunnels > Reports to display the Tunnel Inspection Report command pane.
- In the Report template drop-down list, select one of the two default MS Word report templates—Tunnel Inspection Report or Tunnel Inspection Report (with geological overprofile)—or, select a customized version of the report if available.
To create a customized version of either of the provided default templates(for example, add available unused fields to the report),see Create and Edit Customized Report Templates.
- In the Inspection map drop-down list, select the tunnel inspection map on which to base the report.
- In the Station interval field, specify the interval between stations for which you want to include tunnel cross-sections in the report.
The number of cross-sections included in the report depends on the station range specified in the tunnel inspection map and the distance you specify here.
- Check the Scale the Plan View image to fit the layout check box if you want the image to expand to the limits of the X axis in the report frame to aide in visibility. Uncheck the check box to keep the image at its original scale.
- In the Image Scaling for Cross-Section View group box, select the most appropriate option:
- Use the same scale for all stations - All cross-sections displayed in the report will be drawn to the same scale.
- Best fit scale per station - All cross-sections displayed in the report will be drawn to the maximum size allowed in the page layout regardless of the scale.
The Tunnel Inspection Report includes a "Delta Histogram" showing the distribution of delta values (within the delta tolerance specified for the the selected inspection map). It also includes in the "Delta Statistics" section of the "Summary" table key statistical values (average, standard deviation, variance) for the entire inspection mesh.
The range of delta distances available is determined by the Delta Tolerance specified for the selected inspection map in the Tunnel Inspection Map Properties pane. For example, if the Delta Tolerance is 1.0m, the left-most X axis value is -1.0m and the right-most X axis value is 1.0m, resulting in a range of 2m. If the Width interval of histogram is 0.01m, 200 vertical bars will be drawn in the histogram.
Color for the histogram is determined by settings specified in the Edit Color Mapping dialog for the associated Tunnel Inspection View.
The Histogram Plots controls enable you to determine how information is displayed in the histogram.
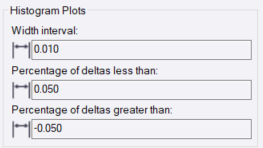
- In the Width interval field, enter a value specifying the range of delta distances to be represented by each vertical bar in the histogram.
- In the Percentage of deltas less than field, enter a delta value for which you want to see the percentage of delta values that are equal to or less than this value. This percentage is displayed in the "Statistics of Inspection" table included in the report.
- In the Percentage of deltas greater than field, enter a delta value for which you want to see the percentage of delta values that are greater than this value. This percentage is displayed in the "Statistics of Inspection" table included in the report.
- If you selected to run the Tunnel Inspection Report (with geological overprofile), in the Geological overprofile type drop-down list, select the appropriate option:
- TBM heading
In the Offset to geological overprofile border (A) field, enter a positive value that specifies the radial offset distance from the tunnel design to define the border to be used to automatically compute the geological overprofile area.
- Drill and blast heading
In the Offset to geological overprofile border (A) field, enter a positive value that specifies the radial offset distance from the tunnel design to define the outer border to be used to automatically compute the geological overprofile area.
In the Offset to geological overprofile border (a) field, enter a positive value (less than value A) that specifies the radial offset distance from the tunnel design to define the smaller inner border to be used to automatically compute the geological overprofile area.
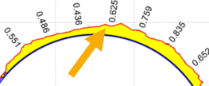
See the diagram in the command pane for a description of the cross-section view. Hover your cursor over the diagram to see its key.
Optionally, change any of the colors used in the cross-section view.
- TBM heading
- Click the Apply button.
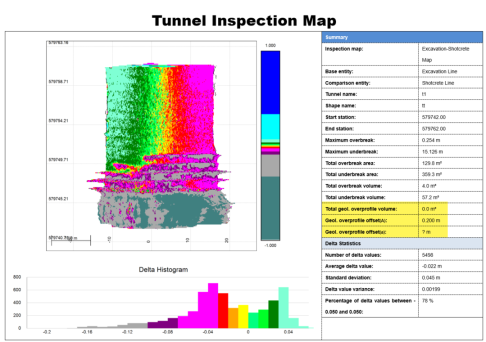
The report opens in MS Word. The first page shows information about the selected tunnel inspection map, including an image of the map from the Inspection Plan View tab in the Tunnel Inspection View command. The "Delta Histrogram" is located at the bottom of the page. If you selected to create the Tunnel Inspection Report (with geological overprofile), the geological overprofile information is included in the "Summary" table (highlighted yellow) in the example below).
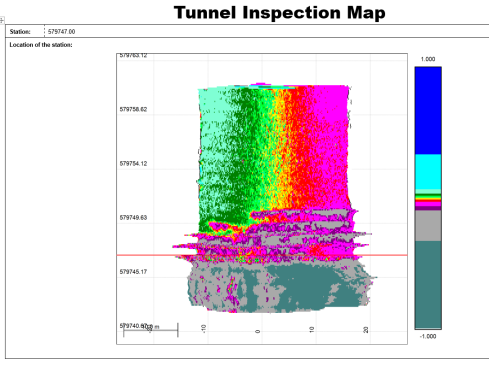
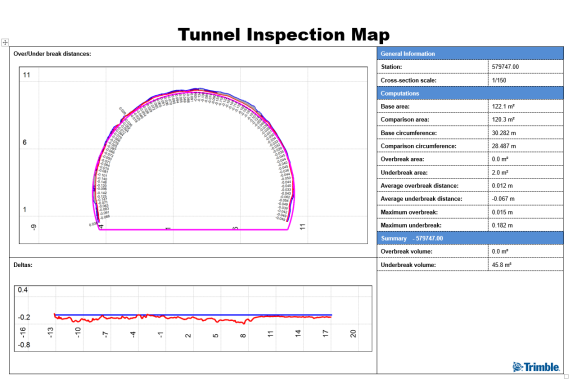
Following the first page of the report, each station is represented by two pages of information, including the same images that are displayed on each of the graphic tabs for the station in the Tunnel Inspection View command.
- Optionally, save the Word file with a new name to the location of your choice.
